

We first constructed the index 20 years ago (Chinn and Ito, NBER WP No. 8967)! See the website for the data.
Here’s a map of financial openness in 2020 (normalized index, 1 to 0). The darker, the more open.
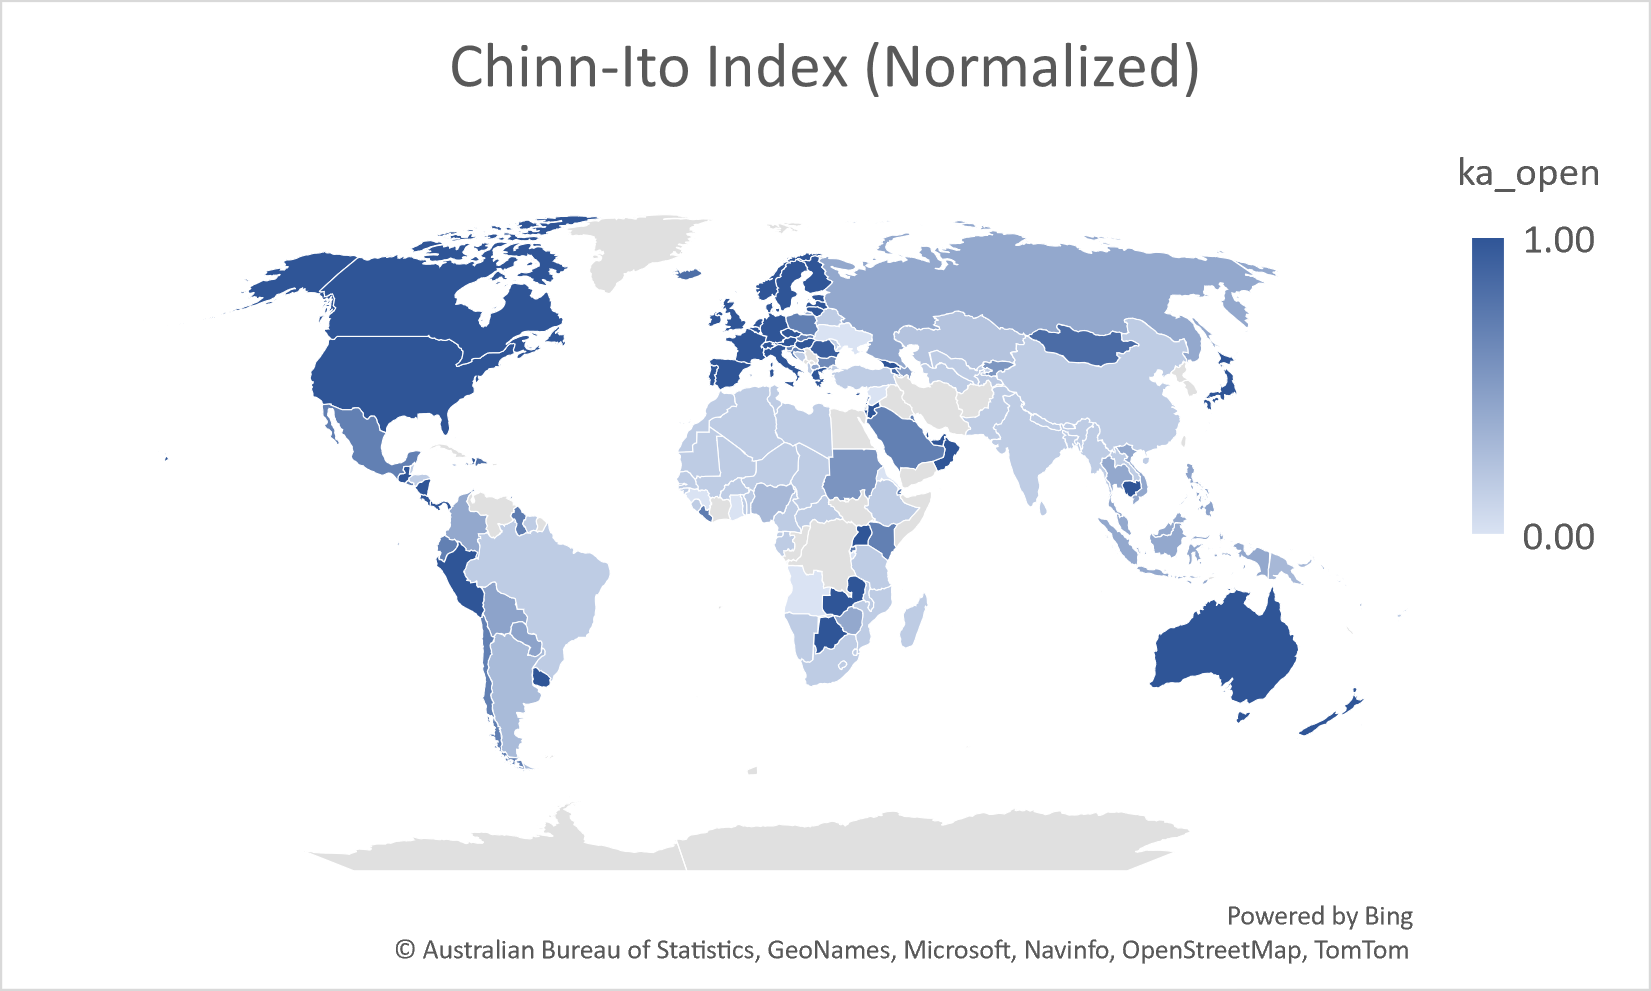
The description of the current dataset is Ito and Chinn (2022).
Hiro Ito and I constructed the index because there was few single, widely available and consistently updated measures of financial openness at the time, with the exception of Quinn’s (APSR, 1997) measure, which at the time was more limited in coverage. Individual dummy variables based on the IMF’s (old) de jure classification of controls (on exchange rates, export proceeds, capital account, current account) didn’t prove informative in one of my early empirical analyses of financial development (Chinn, 2004, ungated version here). The Chinn-Ito index, based on the aforementioned IMF de jure classifications, was converted into a single index using by taking the first principal component (essentially — the capital account component is smoothed), and was developed for a project to assess how financial openness correlates with financial development, published in JDE (2006) (with lots of help from friends, including Ashok Mody, Antu Panini Murshid).
Quinn, Schindler and Toyoda (IMF Econ Rev 2011) provide an early comparison of measures. More recent comparisons are in Graebner et al. (2021) and Erten et al. (2021). In the aggregate, the measures move together.
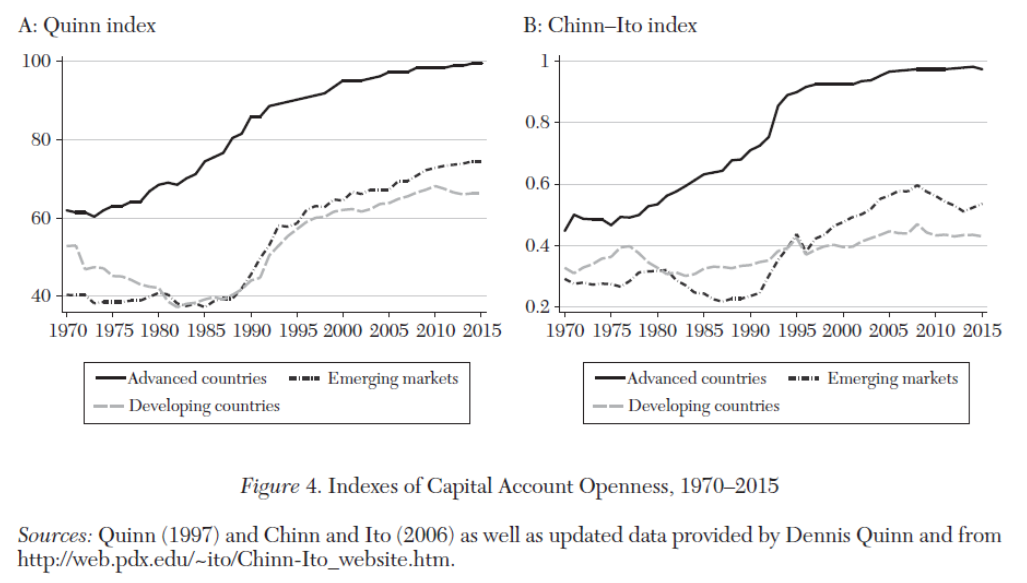
Source:Erten, Korinek, Ocampo (JEL, 2021).
However, on an individual country-year basis, the correlation of changes in the KAOPEN index and changes in other indices ranges from 0.01 to 0.29 (the latter significantly different from zero).
Ito and I do not claim there aren’t better indicators. For instance, the one created by Fernández, Klein, Rebucci, Schindler and Uribe (2016) is based on the IMF’s more detailed tabulation of de jure restrictions, both on inbound and outbound flows, and probably better captures the impact of controls. However, the coverage of this index is restricted to 1995 onward, limiting the span of data that can be analyzed statistically.
The map above shows a snapshot of financial openness. What does our index say about the evolution of financial openness over the past decade (2010 to 2020)? Here is a map of the change in our index.
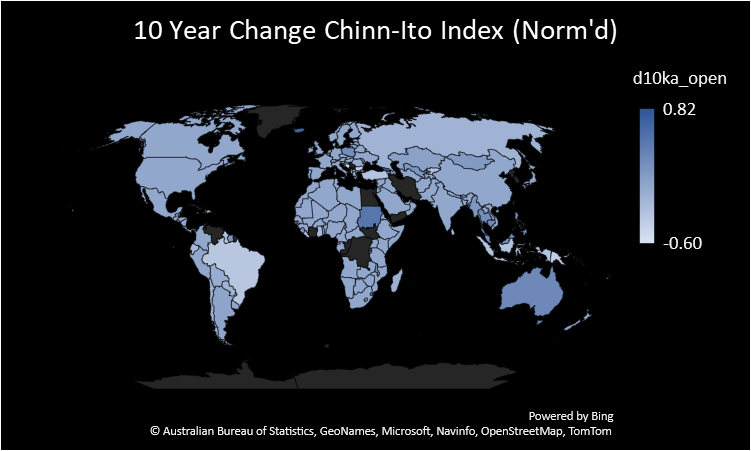
Note that there has been substantial stability in the measured degree of financial openness; in the map above, most countries experience a 0 change in ka_open (e.g., China).

