

With yesterday’s employment situation release (discussed in this post), we have data employment by sectors, as well as corresponding average hourly earnings. We don’t have the CPI for that month, but using nowcasts, we can guess what is likely to be happening to real wages.
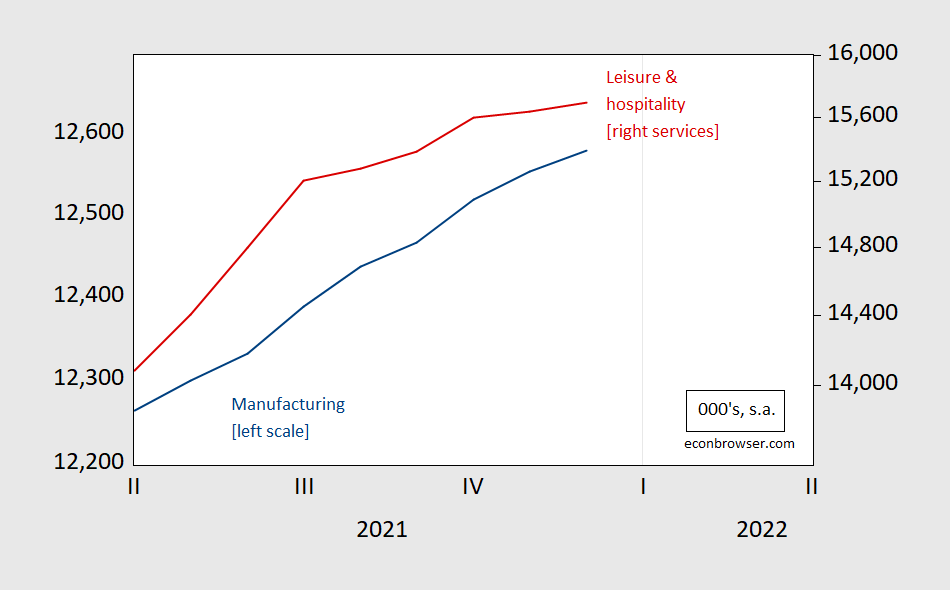
Figure 1: Manufacturing employment (blue, left log scale), and leisure and hospitality services (red, right log scale), both in 000’s, s.a. Source: BLS.
Leisure and hospitality services employment was flattening out even before omicron’s impact could have been felt. That being said, this sector’s employment preliminary estimates have been subject to (relatively) big revisions: 0.38 percentage points, compared to 0.06 points for manufacturing, for instance and 0.09 for all of nonfarm payroll employment.
Average hourly earnings rose rapidly in December. The evolution of inflation adjusted hourly earnings has varied by sector. This is shown in Figure 2.

Figure 2: Average hourly earnings in all private nonfarm payroll employment (blue), in manufacturing (red) and leisure and hospitality services (teal), for production and nonsupervisory workers, all in 2020$, s.a. December CPI used is Cleveland Fed nowcasted value. NBER defined recession dates peak-to-trough shaded gray Source: BLS, Cleveland Fed (accessed 1/8), and author’s calculations.
Real wages rose in total nonfarm payroll and hospitality and leisure, while flat in manufacturing. These are not composition adjusted wages, however. Goldman Sachs indicates their “composition-corrected wage tracker stands at +4.1% in Q4 (vs. +4.0% in Q3)”. This compares to the +6.9% (and +6.7% in Q3) implied by the BLS overall nonfarm payroll employment series (AHETPI via FRED). Real composition-adjusted wages would then be falling given CPI’s evolution. That’s not good news for returns to labor; on the other hand it takes away from the wage-price spiral narrative.

